
Cape Town leads South Africa in broadband speeds
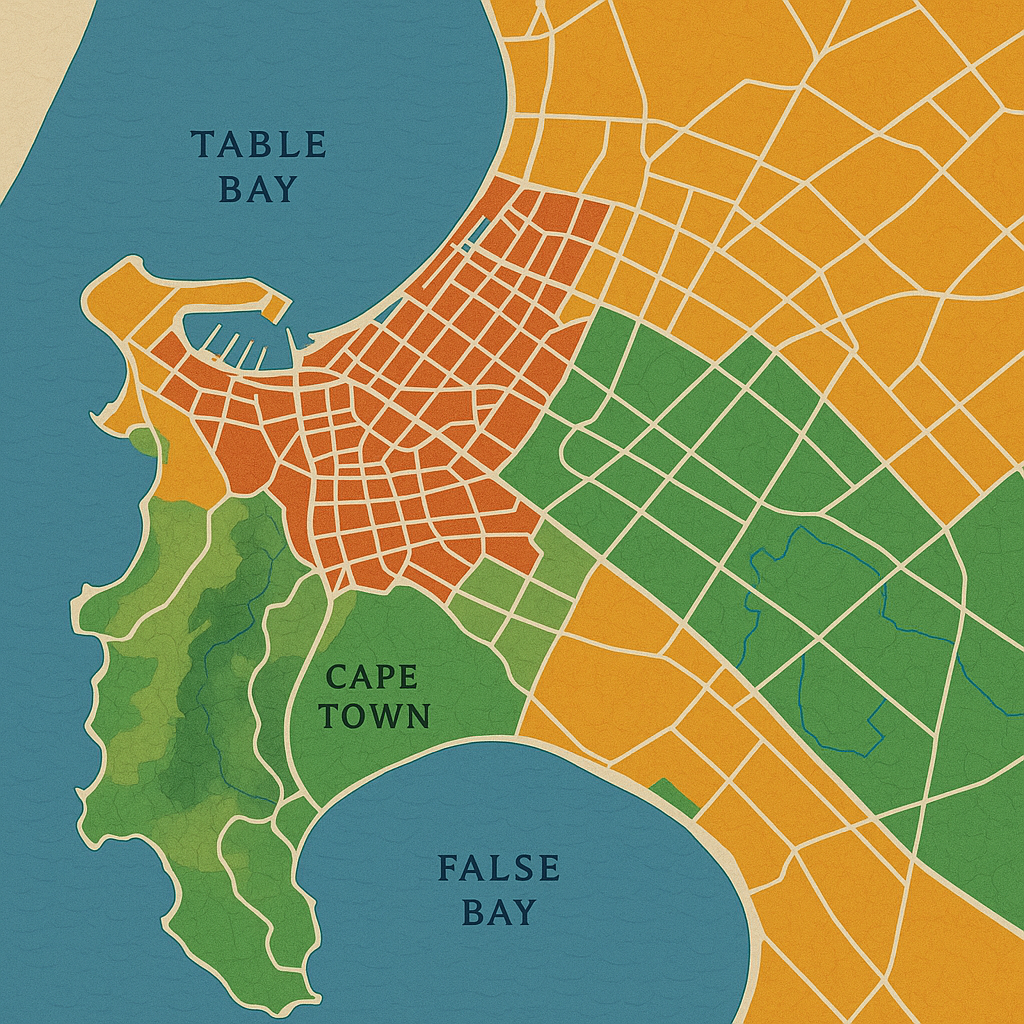
Explore Cape Town's broadband divide: 99 Mbps in the CBD vs 21 Mbps in Delft South. Unpack the tech, economics, and social factors.
Cape Town's internet speeds are wildly different across the city! The fancy City Bowl zooms at 99 Mb/s because it's packed with businesses and has tons of fiber options. But in places like Delft, speeds crawl at 21 Mb/s. This is due to fewer fiber lines, older phones, and people choosing cheaper internet plans. It's like a patchwork quilt, with some areas having super-fast connections and others lagging far behind.
Why is there such a significant difference in internet speeds across Cape Town suburbs?
Cape Town's internet speed disparities stem from a combination of infrastructure, economics, and demographics. Densely populated, commercially vital areas like the City Centre benefit from extensive fibre competition and easier installation. In contrast, areas like Delft face challenges including limited infrastructure, lower-end user devices, and socio-economic factors influencing package choices.
Get Cape Town news in your inbox
Stay updated with the latest stories from the Mother City.
Section 1 – A New Champion on the National Scoreboard
On the first day of April 2026, MyBroadband unloaded 1.2 million fresh speed measurements, all captured by Android phones between New Year’s Day and the end of March. After scrubbing VPN traffic and locking each test to a single suburb, 121 000 Cape Town readings survived the sieve. The aggregate numbers - 36 Mb/s down, 28 Mb/s up, 37 ms idle latency - were strong enough to bump the Mother City above Midrand, Century City Johannesburg and uMhlanga for the first time since the tracker began eight years ago.
The stand-out statistic is the City Centre’s 99.34 Mb/s average, built from more than 4 800 individual runs - more samples than Polokwane produced in the same quarter. Even the CBD’s bottom 10 % of tests still hit 54 Mb/s, a figure that would place in the top three of seven other provinces. In short, the downtown figure is not a fantasy delivered by a handful of tech-savvy high-rises; it is the lived reality of thousands of residents and office workers who hammer the network every night.
Section 2 – Anatomy of a 99 Mb/s Neighbourhood
Take a late-night stroll along Bree, Loop or Long Street and your phone will sniff sixty-odd operator SSIDs: Vumatel, Openserve, Octotel, Frogfoot, MetroFibre, ZoomFibre, Evotel, LinkLayer, SADV, Lightstruck, TT Connect, Netstream and a swarm of 60 GHz mesh hobbyists. Nowhere else in the country can you pick from four separate fibre wholesalers selling gigabit symmetrical plans for under R900, and landlords have started marketing “triple-redundant fibre paths” the way they once boasted about diesel generators.
Two ingredients make this possible: geology and economics. The downtown grid is only four square kilometres yet holds 2 500 commercial buildings and 6 200 sectional-title flats. Every second block already hosts council power and water manholes, so blowing a 12 mm micro-duct costs about R12 per metre - half the price of trenching through tree-lined suburban sidewalks where each homeowner must sign a consent form. More competition lowers retail prices, higher take-up triggers more speed tests, and the suburb keeps climbing the ladder.
Section 3 – Northern Suburbs: Claremont, Durbanville and the Rural Edge
Durbanville’s 72 Mb/s median shocks no one - wine estates turned business parks have deep pockets and room for overhead fibre - but Claremont’s 67 Mb/s tells a richer story. The area is a jumble of 1970s houses and 1990s apartment blocks, yet two back-haul rings intersect here: Vumatel’s trenching beside the Main Road rail reserve and Openserve’s legacy copper bundles that were replaced strand-for-strand with glass on existing poles. Shoppers can pick from eighteen ISPs, and Afrihost’s 500 Mb/s bundle costs R50 less than Telkom’s ageing 100 Mb/s DSL next door in Plumstead.
Milnerton “Rural” (Century City, Montague Gardens, Marconi Beam) owes its 64 Mb/s to four data centres - NAPAfrica Cape IX, Hetzner, Teraco CT1 and Amazon’s incoming edge node - within a two-kilometre radius. Any provider that buys a 10 Gb port in the meet-me room can light up surrounding complexes the same afternoon, so residents become accidental first hops on tier-one backbones.
Section 4 – South-East of the N2: Where Speeds Halve
Cross the N2 and the story splinters. Kuils River averages 48 Mb/s, cushioned by affluent homeowners and by Amazon’s CPT10 warehouse, whose staff village demanded resilient fibre. Strand sits exactly on the national mean - 36 Mb/s - because 1970s beach cottages and new gated estates cancel each other out.
Keep going north-west and you crash into Delft South at 20.95 Mb/s. The culprit is not one choke but a stack: a single 10 Gb Vumatel head-end in Belhar feeds the whole zone; most houses are RDP stock without internal piping, so installers nail fibre to outside walls, creating micro-bends and 3–4 dB light loss; 38 % of Android tests come from phones under R1 500 whose Wi-Fi 4 radios top out at 35 Mb/s; the best-selling package is a 20 Mb/s asymmetrical plan at R399, dragging the mean downward. Mitchells Plain, Philippi East and Nyanga echo the pattern: fibre is laid in “micro-pockets,” and jobless rates above 30 % push families toward pause-friendly LTE instead of twenty-month contracts.
Section 5 – Latency, 5G, Wi-Fi 6E and the Layer-Cake Future
City-wide latency of 37 ms looks stellar against an African backdrop of 80 ms, yet suburbs diverge wildly. CBD gamers ping AWS Cape Town in 2–3 ms, while Delft packets first cruise to Belhar, then ride the N1 backbone to Johannesburg at 54 ms. In other words, local servers feel like LAN, but Gauteng lobbies feel like London.
Wireless is rewriting the canvas. RAIN and MTN’s 5G NR-NSA on the Tygerberg mast gifts parts of Bellville 200 Mb/s down (15 Mb/s up) for R699. Because speed-test apps geolocate by tower, these fixed-wireless numbers blend into fibre averages; strip them out and Bellville drops from 93 Mb/s to 51 Mb/s. In wealthier streets, 6 GHz Wi-Fi 6E routers push 1.5 Gb/s indoors, yet Android logs them as “500 Mb/s fibre,” masking the final 30 m of unlicensed spectrum.
Looking ahead, Openserve will scrap all copper by December 2026 and sell 20 Mb/s fibre for R299 in townships. The City’s own 180 km metro ring may offer gigabit symmetrical to 5 000 poor households in Langa and Manenberg at R50. Load-shedding has already forced ISPs to bundle 4-hour lithium UPS units, nudging CPE prices up 12 %. Starlink kits pop up on Clifton roofs not for raw speed but for redundancy, while Amazon’s Project Kuiper gateway at Matjiesfontein trials 50 Mb/s links in Philippi, trimming latency from 89 ms to 42 ms.
Cape Town’s broadband map is no longer a static table; it is a living negotiation between glass under the pavement, pesos left after rent, and the ingenious ways households blend fibre, 5G and low-orbit beams. The CBD’s 99 Mb/s is not the finish line - it is the benchmark every other suburb will bargain against for the next decade.
[{"question": "
Why do internet speeds vary so much across different parts of Cape Town?
\nInternet speeds in Cape Town differ significantly due to a combination of infrastructure availability, economic factors, and demographics. Areas like the City Bowl benefit from extensive fiber optic networks and high competition among providers, driven by a concentration of businesses and residents. In contrast, areas such as Delft have fewer fiber lines, older mobile devices, and residents often opt for more budget-friendly internet plans, leading to much slower speeds.
\n}, {\n"question": "How does Cape Town's internet speed compare nationally?
\nAs of April 2026, Cape Town's aggregate internet speeds, with an average of 36 Mb/s down, 28 Mb/s up, and 37 ms idle latency, have surpassed those of Midrand, Century City Johannesburg, and uMhlanga. This marks the first time the city has ranked highest since the internet speed tracker began eight years ago, indicating a significant improvement in its overall connectivity.
\n}, {\n"question": "What makes the City Centre's internet speeds so exceptionally fast (nearly 100 Mb/s)?
\nThe City Centre boasts an impressive average of 99 Mb/s due to a unique blend of factors. Its dense urban environment, with 2,500 commercial buildings and 6,200 sectional-title flats within a four-square-kilometer grid, makes fiber installation highly economical. Numerous fiber wholesalers like Vumatel, Openserve, and Octotel compete fiercely, offering gigabit symmetrical plans at competitive prices. The presence of existing municipal infrastructure (power and water manholes) also significantly reduces the cost and complexity of laying new fiber.
\n}, {\n"question": "Why are internet speeds in Delft significantly lower compared to other areas?
\nDelft's average speed of around 21 Mb/s is attributed to several interconnected issues. The area is primarily served by a single 10 Gb Vumatel head-end in Belhar, creating a bottleneck. Many RDP houses lack internal piping, forcing installers to run fiber along exterior walls, which can lead to signal loss. A substantial portion (38%) of Android speed tests come from older, less capable phones (under R1,500) with Wi-Fi 4 radios that cap out at 35 Mb/s. Furthermore, the most popular internet package in Delft is a 20 Mb/s asymmetrical plan, which naturally lowers the average speed. High unemployment rates also lead families to choose flexible, pause-friendly LTE options over long-term fiber contracts.
\n}, {\n"question": "How is wireless technology impacting Cape Town's internet landscape?
\nWireless technologies are rapidly changing Cape Town's internet landscape. 5G NR-NSA services from providers like RAIN and MTN are delivering speeds of up to 200 Mb/s in areas like Bellville. While these fixed-wireless numbers can blend into fiber averages, they offer a strong alternative. Additionally, advanced Wi-Fi 6E routers are providing extremely fast indoor speeds (up to 1.5 Gb/s) in wealthier areas. Satellite internet services like Starlink and the upcoming Project Kuiper are also emerging as crucial options, not just for speed but for redundancy and reducing latency in underserved regions.
\n}, {\n"question": "What does the future hold for Cape Town's internet connectivity?
\nThe future of Cape Town's internet is dynamic and multifaceted. Openserve plans to completely phase out copper infrastructure by December 2026, shifting entirely to fiber, with affordable 20 Mb/s fiber packages expected in townships. The City of Cape Town's own 180 km metro fiber ring aims to provide gigabit symmetrical speeds to 5,000 low-income households in areas like Langa and Manenberg at highly subsidized rates. Load-shedding has also prompted ISPs to bundle UPS devices with CPE, increasing resilience. The combination of expanding fiber, advanced wireless solutions like 5G and Wi-Fi 6E, and satellite internet (Starlink, Project Kuiper) suggests a continuous evolution towards more diverse, resilient, and potentially more equitable connectivity across the city.
\n}]
Emma Botha is a Cape Town-based journalist who chronicles the city’s shifting social-justice landscape for the Mail & Guardian, tracing stories from Parliament floor to Khayelitsha kitchen tables. Born and raised on the slopes of Devil’s Peak, she still hikes Lion’s Head before deadline days to remind herself why the mountain and the Mother City will always be her compass.
View all articles →